Outline
- What is Vision Zero and how can it be part of your Strategic Road Safety Plan?
- Intelligent Data Locates the Risky Road Zones in Your Road System
- Improving Road Design is a Continuous Cycle Involving all Road Users
During the 117th Congress’s first session on May 28, 2021, a bill was introduced to allow State Departments of Transportation to use national funding to develop and implement Vision Zero* plans. This should come as no surprise, when road accidents were responsible for an estimated 38,360 deaths in 2020 in the US. Intelligent data is a major asset when it comes to reaching Vision Zero goals, and data-driven insights are a strategic asset for any strategic road safety plan. In the end, they contribute significantly to making state road systems safer for travel.
What is Vision Zero and how can it be part of your Strategic Road Safety Plan?
The Vision Zero initiative was conceived in Sweden in 1994 and approved by the National Parliament in 1997. The premise is simple: We need road systems to take us where we’re going. No loss of life on the road is acceptable, and injuries should be as minor as possible. When we allow for the fact that humans make mistakes, then we need to design road systems to protect us as much as possible from road accidents. Vision Zero is therefore a natural target in any strategic road safety plan.Accounting for All Road Users when Designing Safe Roads
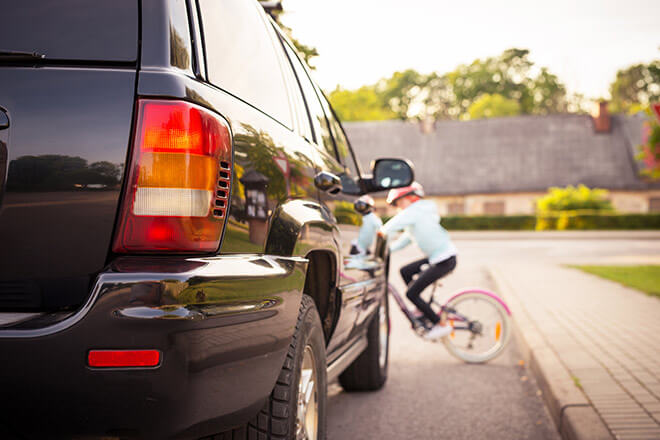
Pedestrians, cyclists and scooters, commercial and passenger vehicles, and public transportation all intersect on closely connected roads and bridges. Beyond road crash reports, understanding their interactions, collective driving behavior and the context of each near miss and accident is key to introducing a preventive approach to road crashes.Intelligent Data Locates the Risky Road Zones in Your Road System
Aggregated and Contextualized Driving Data Highlights Road User Behavior
All of these road users potentially produce data, thanks to the development of personal devices, on-board GPS units and anticipated connected vehicles. Qualitative data can be used to create a more precise view of activity on your road system. Data points on their own are of limited value. When data is aggregated to show collective road user behavior, and contextualized to include the time of day, type of road and weather conditions, it rapidly pinpoints the most frequent locations for near misses, which are potential areas of concern for road accidents.Data Insights for Greater Roadway Context
Data insights give you a much clearer picture of what is happening on your road system.- Cross-referencing road accident data with crash reports corroborates crash locations. This can also be referred to as the “High Injury Network”.
- Instances of harsh braking, sudden acceleration or distracted driving behavior can be indicative of near misses. Severe, frequent recurrences are where road crashes are more likely to happen. Identifying near misses makes a big difference to preventing road accidents.
- It’s also possible to more accurately situate where accidents occur, so that emergency vehicles are sent from appropriate locations and arrive faster. The sooner emergency care is provided after accidents, the more positive the medical outlook.
Understand Your Road Hazards
Your driving behavior data provides you with actionable insights about how to improve potentially risky road zones. You can begin evaluating the hazards present at each. Often, a small number of hazards make up the highest risk for drivers: for example, a missing sign, poor visibility or weather have far greater impact on the number of accidents compared to road condition in a given spot. You can therefore focus on what is specifically required to influence driver behavior and improve road safety. You have enough information to both reduce road accidents and near misses, all part of Vision Zero.Improving Road Design is a Continuous Cycle Involving all Road Users
Involve All Road Users
Once you have identified the problems on the road, it’s also important that all stakeholders are consulted in how to improve a road and make it safer. Department of Transportation representatives, police, cyclist and pedestrian associations and local businesses must all discuss who uses the road, what it’s used for and what everyone’s needs are. The collective approach ensures that the new solution meets everyone’s needs while also making the road a safer place for all.Improving Road Design is a Continuous, Cyclical Process
Vision Zero’s objective is to eliminate fatalities due to road accidents. Incorporating driving data and driver behavior insights into your approach means that you shift your actions from reacting to road accidents to preventing them. You reduce the risk of road accidents. You save people’s lives. Aggregated and contextualized road user behavior and the insights it provides make it possible to test and check road safety solutions, monitor and assess their success, and adjust them again if necessary. And the ability to communicate your achievements comes as an added advantage, so everyone wins. *https://visionzeronetwork.org/vision-zero-not-just-for-big-cities/