Outline
- VRUs vulnerability in Los Angeles and San Bernardino counties, CA
- Results
In this edition of the Michelin Mobility Intelligence Monthly Map, we’re focusing on the state of California.
Vulnerable road users (VRUs), such as pedestrians and cyclists, are continually at risk on our roadways. In just one year from 2020 to 2021, fatal collisions involving VRUs increased a staggering 13% and accounted for approximately 20% of the 42,915 people killed in motor vehicle crashes.
VRUs vulnerability in Los Angeles and San Bernardino counties, CA
In California, the most populous state in the US, VRUs also saw a slight increase in the number of fatalities. By analyzing past crash data from crash-prone areas, and incorporating critical variables like speed, road characteristics, and proximity to high-traffic areas like schools, shopping areas, and sports fields, Michelin Mobility Intelligence is able to rank the 14 cities at the highest risk for Vulnearable Road Users in Los Angeles and San Bernardino counties.For this analysis, crashes from 2016 to 2021 were collectively analyzed to train Michelin Mobility Intelligence’s (MMI) advanced artificial intelligence algorithm, and a red through green rating was assigned to each individual section of road based on its risk assessment projection score for VRUs. A red score indicates no danger to very little danger, while a green score indicates the riskiest sections of road.
To establish the ranking of the riskiest areas, MMI employed a very specific formula guided by advanced machine learning and deep learning algorithms. First, the size of each city’s road network was measured in miles, and then, the total amount of miles shown by our algorithm to have an elevated risk level was measured. Those two mileage amounts were calculated into a percentage of each city’s total road network that appears to be unsafe for VRUs.
Please visit the Monthly Map to view the maps and analysis: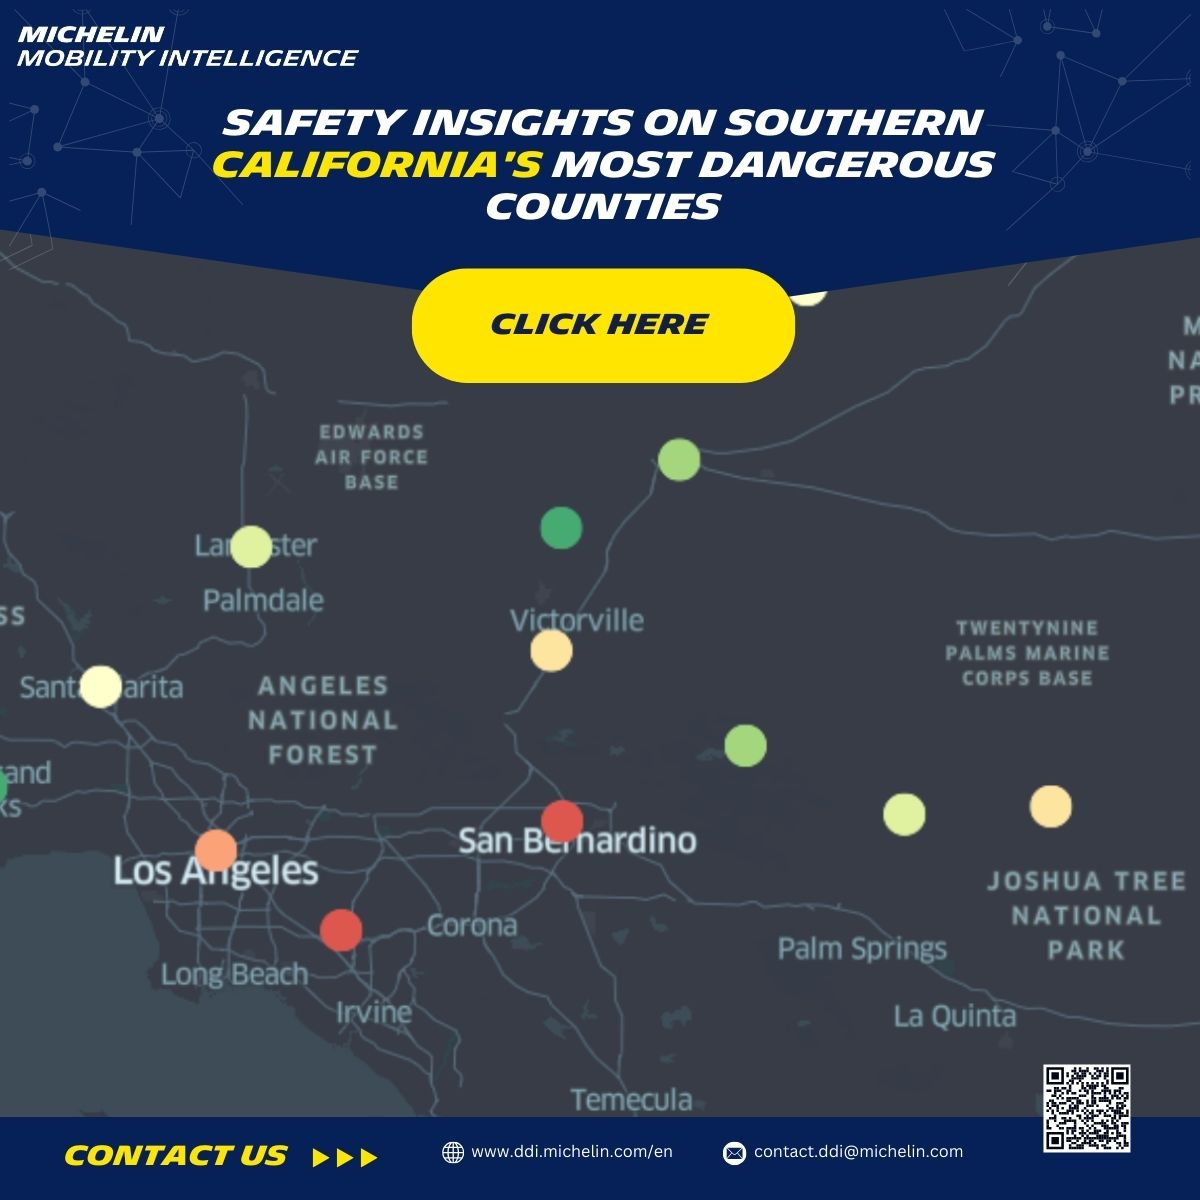
Results
By combining the data around harsh braking and phone handling, our algorithm shows that the most problematic arcs for VRUs are those traveling in the north-south direction. Our data did not show that speed was an influencing factor in this specific area. Our data did show that 7% of trips analyzed showed harsh braking and 7.5% showed phone handling events. These two factors could be the potential causes for high risk.Thanks to our advanced insight, data, and algorithms, Michelin Mobility Intelligence can analyze large geographical areas, ranging from multiple counties to entire states, to identify risky areas for VRUs based on driving behaviors. We are able to integrate new datasets and perspectives for a combination of behaviors, like braking and phone handling events, into consideration. These insights allow cities to proactively manage their efforts before crashes happen, helping them work towards the ultimate goal of Vision Zero.