
Outline
- A Vulnerable Road User Project within a Transportation Network
- How to Protect VRUs Using Artificial Intelligence and Near Miss Hotspots
- KPIs to Help You Improve Your Road Safety for VRUs
On rural roads, and in city centers in a developing multimodal context, vulnerable road users are at a higher risk of having a fatal accident. A targeted effort is required to deal with this specific road safety issue. Technology can provide critical data for protecting pedestrians, cyclists and people in general as road users. It draws a sharper image of what is going on throughout a transportation network. Complementing past car crash data, technology provides insights into how context influences road safety, and how vulnerable road users and motorists interact with each other. To pre-empt car crashes, road safety experts can apply technology to help detect and locate where and why vulnerable road users may be the most at risk – saving lives and bringing your transportation network closer to Vision Zero goals.
A Vulnerable Road User Project within a Transportation Network
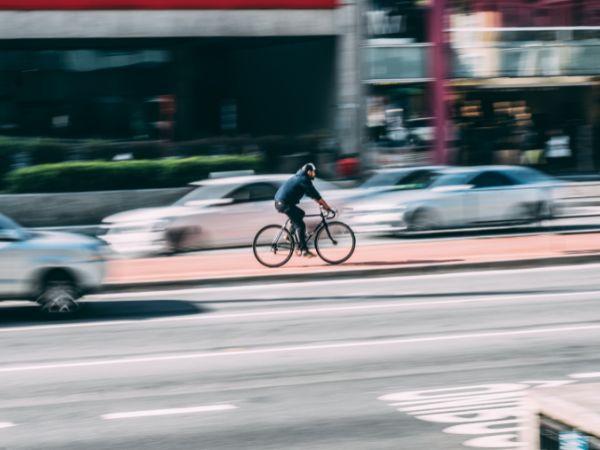
Vulnerable road users – VRUs – aren’t protected by an exterior shell. People, including pedestrians, cyclists, motorcyclists, anyone physically disabled, the old, the very young, etc., all run a higher risk of fatality if a crash occurs with a motor vehicle, be it a car, van, truck, bus, or tram. To address this concern, introducing a Safe System approach is an important initial step to integrating VRUs fully into all road infrastructure. A Safe System requires shifting from thinking of a road network to thinking of a transportation network. A road network considers primarily motor vehicles’ needs, whereas a transportation network considers all road users’ needs: motor vehicles, public transit, pedestrians, children, and all other VRUs.
Technology’s Additional Insights about VRUs on the Road
Part of the shift to a Safe System also involves recognizing those locations where vulnerable road users are more at risk in terms of road safety. As children exit a school bus, at pedestrian crossings, along bicycle lanes – all are examples of locations where road safety may be a concern. This is where data has a role to play.
As Jane Terry, Vice President, Government Affairs at the National Safety Council observes1, “Over half of fatalities occur on just 20% of roadways. I’ve seen that over and over in communities. I definitely encourage communities to look at their data and map it out to be able to get to that granular information.”
Where should you focus your efforts to find these locations? Technology exists that looks specifically at VRUs, providing insights to authorities about where and when pedestrians and other VRUs are at risk – before crashes happen. With better information, road experts can more easily interpret issues, more accurately predict what could happen, and proactively address dangerous situations.
The Infrastructure Act Focuses on Technology as part of Introducing Vulnerable Road User Policy
The arrival of this new technology offer dovetails with the Infrastructure Act’s Safer Streets and Roads for All federal grant program. The SS4A program emphasizes embracing technology as part of solutions to improve road safety for VRUs. With the data provided by the technology, current road safety initiatives and concerns can be accelerated thanks to an increase in funding.
How to Protect VRUs Using Artificial Intelligence and Near Miss Hotspots
At MICHELIN DDi, we’ve focused our technology and expertise on a two-pronged approach that helps make roads safer for VRUs.
Artificial Intelligence to Locate Cyclist and Pedestrian Safety Hotspots
Our unique machine learning model detects and locates locations in a transportation network according to how unsafe they were historically for VRUs. Our algorithm crunches historical car crash data and contextual road data specific to cyclists, pedestrians and other VRUs to identify patterns and trends.
Near Miss Hotspots for Roadway Users on a Transportation Network
We also study near misses for an even clearer idea of road activity. Just as car crashes tend to occur in the same locations, there are also repeated near-crash patterns (such as harsh breaking, harsh acceleration, etc). Investigating near misses gives road safety experts a more explicit understanding of what’s happening on the transportation network.
Combining potentially risky hotspots for VRUs with near miss hotspots strongly indicates those areas where pedestrians and cyclists are more at risk. It’s then possible to calculate and rank near miss hotspots for vulnerable road users according to severity throughout a transportation network. Analyzing the driving events – where and when they happen, where they cluster, in what kind of context they occur (weather, time of day, day of week) – shows what preventive measures can be introduced. It may be adding a bicycle lane for cyclists, or introducing beacon lights for a pedestrian crosswalk, or building a protected drop-off lane for a school bus. Road safety experts can act before crashes. Safety for pedestrians, cyclists, and other vulnerable road users – even all road users – is anticipated and maximized.
KPIs to Help You Improve Your Road Safety for VRUs
Applying our technology to address vulnerable road user safety in your transportation network offers modularity for your analyses, and key performance indicators to both measure your progress and communicate with.
The data slips into your GIS. You can filter by road feature, type of driving event, and pedestrians or cyclists. After introducing safety measures at a location, you can compare before and after results to assess achievements, and to also go further in your road safety strategy.
Far from replacing the knowledge, data, and expertise that your Road Safety Department has accumulated over the years, technology only adds to what you already have in place: “a community of intelligence [where] technologies complement each other,” as summarized1 by George Villareal, Deputy Director Traffic Safety Operations, TxDOT.

1https://itsa.org/event/how-technology-is-helping-protect-vulnerable-road-users/