
Outline
- Challenge 3: First- and Last-Mile Road Safety
- Challenge 4: Addressing Infrastructure Inequity
- Challenge 5: Where to Start with an Active Transportation Program and How it May Affect Budget
- Using New Technology for Road Safety and Sustainability Concerns in Your Active Transportation Policy
Active transportation can initiate a virtuous circle where road safety can improve, pollution may be lowered, and economies and communities may be positively impacted. The second part of this article continues to looks at some of the common challenges in developing an active transportation policy, plus a few inspirational initiatives.
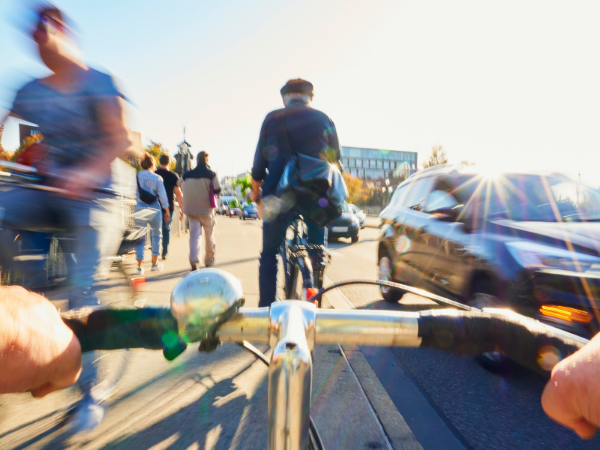
Challenge 3: First- and Last-Mile Road Safety
People in low density areas may have little choice beyond their motor vehicle for getting from a public transportation stop to their destination. When Departments of Transportation offer communities alternative modes of mobility for these short trips, there is greater adoption of new transportation measures and infrastructure.
Ensuring first- and last-mile mobility helps in creating a successful active transportation program. The “15-minute rule” is often referred to as a measurement of a system’s quality: a person should only have to make short trips, a 15-minute bicycle ride or walk to get to work, home, the stores, the park, etc. from a transit stop. A thorough understanding of demographic characteristics throughout a transportation network highlights how the rule can be applied to increase access to active mobility.
A variety of techniques make the first and last miles accessible and increase road safety for public transportation and active transportation users. These include feeder buses, increased service during peak hours, bicycle sharing, signal and road sign priority at intersections, curb extensions at bus stops, micro-mobility solutions, improved lighting, etc. Choices of what techniques to apply depend on local laws, expectations, and objectives.
Challenge 4: Addressing Infrastructure Inequity
A lack of first- and last-mile transportation can also lead to infrastructure inequity among certain communities. They can be penalized in terms of access to green space and experience increased levels of pollution. At high levels, air pollution – from nitrogen dioxide or particulate matter smaller than 2.5 microns (PM2.5) – can affect the respiratory and cardiovascular system.
Cars have long been prioritized over other travel modes. Between roads and parking, motor vehicles dominate the public space. New York City has even estimated that reclaiming 25% of its street space in favor of active transportation infrastructure would result in giving back the equivalent of 13 Central Parks12 to pedestrians, cyclists, and citizens.
Disadvantaged communities can also suffer more from pollution. A University of Minnesota study13 from 2014 found that they are exposed on average to 38% higher levels of outdoor nitrogen dioxide in the places they live, rural and urban. An active mobility plan can have a positive effect on air quality and quality of life for these populations.
First- and Last-Mile and “Bikepooling” Initiatives
In Oregon, Washington County’s 2021 strategy for infrastructure projects that address the first and last miles14 places safety and security at the top of its list of goals. It considers land use, opportunities for increasing access to active transportation, and parking management requirements. It also provides key considerations for, among others, bicycle and scooter sharing, car sharing, rural van sharing, ride hailing, and mobility hubs. Specifically listed as first- and last-mile infrastructure improvements are crosswalks, sidewalks, bicycle facilities, wayfinding, intersection improvements, and lighting. Finally, it provides a number of case studies of locations where road safety is now better as a result of first- and last-mile improvements.
As for the Civic Bicycle Commuting research project (CiBiC15), launched by an associate professor at UCLA, it aims to get residents from low-income neighborhoods to cycle to work in groups. Cyclists sign up on an app and give their destination, and a group of up to 12 cyclists rides together, dropping employees off at their stops as they go. The group is topped and tipped by safety experts who help to create a safe ride. The group’s size makes them visible, providing all-important “safety in numbers”. Currently a trial program, the goal is to integrate CiBiC into a community organization, Los Angeles’ city government or even the region’s transit agency.
Challenge 5: Where to Start with an Active Transportation Program and How it May Affect Budget
A wide variety of resources, best practices and benchmarks exist for active transportation plans, both in terms of road safety and sustainability. A number of associations also house knowledge and experience that can bolster projects, from bicycle lanes to safe routes to school: the National Association of City Transportation Officials (NACTO16), pedestrian and bicycle organizations17, an the NHTSA’s own resources for active transportation18.
The Complete Streets19 program is specifically dedicated to increasing active transportation. Taking extra care to improve road safety and sustainability, it can help focus vision and intent for your own active transportation program, and therefore its design and implementation.
Changes to road infrastructure do have to be factored into your budget. But no major upheavals should be needed. They can be small and incremental, and made across a large geographical area. Each improvement can be evaluated before being applied to a new location. Changes can also be opportunistic, by taking advantage of regular maintenance as the ideal moment to introduce active mobility features. Little by little, active transportation infrastructure spreads to all parts of an area.
Another resource to tap is Smart Growth America, a non-profit organization based in Washington, DC, dedicated to helping communities be resilient and healthy. It evaluates Complete Street programs according to 10 topics, from vision and intent, user diversity, and clear, accountable exceptions, to land use and context sensitivity, performance measures, and project selection criteria. Their reports are a good place to get an overall view of the diversity in projects, program funding, and solutions that communities develop thanks to clear vision and leadership, and getting all stakeholders involved.
Budget Impact and Infrastructure Funding Initiatives
In a Smart Growth America 2015 report20, 37 Complete Streets projects finished the previous year were evaluated. Altogether, the projects recorded a 70% drop in crashes and a 56% drop in injuries, leading to an estimated $18.1 million avoided in collision and injury costs – visits to emergency; to the hospital, doctor, and for rehabilitation; and property damage. As for the budget required, on average the projects paid for themselves in eight years, and some after just a year.
When federal or state funds become available, the city of Orlando, Florida21 gets all interested parties to participate in projects, like an ecosystem. In the natural world, plants, trees, insects, and animals all have a role to play to support each other. In communities, different backgrounds, ages, and experiences make up the ecosystem. It’s through partnership that everyone becomes stronger.
Using New Technology for Road Safety and Sustainability Concerns in Your Active Transportation Policy
Technology and data are new levers that provide technical assistance and give more valuable information to road authorities. They help road experts identify areas where road safety, in particular for vulnerable road users (VRUs), and sustainability need attention, so that experts can plan their actions accordingly.
Indeed, increasing the proportion of active transportation travel in your transportation network also means rethinking road safety developed for car users. An active transportation program creates new areas of risk that have to be identified – and driving data can help.
Based on driving data behavior expertise and millions of connected drivers, MICHELIN DDi can help your active transportation infrastructure efforts by providing driving events insights, near miss hotspot severity rankings and car crash probability indicators for your entire transportation network, including those that specifically involve VRUs.
Near Miss Hotspots for Vulnerable Road Users
Our approach to identifying locations where VRUs are potentially at higher risk draws on artificial intelligence and near miss hotspots in a transportation network. Our proprietary algorithm uses machine learning to analyze historical car crash data and road data context specific to VRUs, identifying and analyzing patterns and trends. Studying near miss hotspots gives a more explicit understanding of what’s happening on the transportation network.
Cross-referencing the two strongly indicates those areas where pedestrians and cyclists are more at risk. Near miss hotspots specific to vulnerable road users can be calculated and ranked according to severity throughout a transportation network.
KPIs to Improve Road Safety and Sustainability as You Pursue Your Active Transportation Policy
Across a large geographic area, you can query our driving data according to different contexts, such as the weather – raining or not; the time of the day – during rush hour, for example; the day of the week – looking at game days, for example; and locations – such as public transportation hubs.
Slipping into your GIS system, our driving behaviour insights helps you see where your road safety can be improved vulnerable road users as you upgrade to active transportation. You have specific data that helps you analyze each location. You can make the best decisions that will improve your overall road safety and sustainability efforts, for all road users and communities.

12https://electrek.co/2022/05/12/nyc-wants-to-take-25-of-its-street-space-away-from-cars-in-favor-of-a-walkable-bikeable-city/
13https://cse.umn.edu/college/news/groundbreaking-nationwide-study-finds-people-color-live-neighborhoods-more-air
14https://washcomultimedia.s3.amazonaws.com/CMSBigFiles/LUT/PDS/FLM/FLM_Final_Report_w-Appendices_022621.pdf
15https://cibic.bike/
16https://nacto.org
17https://www.pedbikeinfo.org
18https://www.transportation.gov/mission/health/active-transportation
19https://highways.dot.gov/complete-streets
20https://smartgrowthamerica.org/resources/best-complete-streets-policies-of-2015/
21https://bloombergcities.jhu.edu/news/cities-use-innovation-get-smarter-about-infrastructure